
EJEMPLO 1 Grafico de pendientes de la ecuación diferencial explícita

Con Geogebra
Donde dice Entrada: escribir SlopeField[x+y^2]

Con Mathematica
Escribir el comando VectorPlot[{1, x+y^2}, {x,-3,4}, {y,-2,2}, Axes -> True, VectorStyle -> Arrowheads[0.02]] y luego presionar Shift+Enter

EJEMPLO 2 Parábola de ecuación cartesiana explícita

Con Geogebra
Donde dice Entrada: escribir y^2, presionar enter

Con Mathematica
Escribir el comando Plot[x^2, {x,-2,2}], luego presionar Shift+Enter

EJEMPLO 3 Circunferencia unitaria
Con Geogebra
Donde dice Entrada: escribir x^2 + y^2 = 1

Con Mathematica
Escribir el comando ContourPlot[x^2 + y^2 == 1, {x,-1,1}, {ỵ,-1,1}] y luego presionar Shift+Enter

EJEMPLO 4 Rosa de ecuación paramétrica

Con Geogebra
Donde dice Entrada: escribir Curve[cos(3t)cos(t), cos(3t)sin(t), t, 0, 2π]

Con Mathematica
Escribir el comando ParametricPlot[{Cos[3t] Cos[t], Cos[3t] Sin[t]}, {t, 0, 2 Pi}] y luego presionar Shift+Enter

EJEMPLO 5 Curva paramétrica en el espacio de ecuación 

Con Geogebra
Donde dice Entrada: escribir Curva[cos(t), sen(t), t, t, 0, 2 Pi], presionar enter, luego ir a View y tildar 3D Graphics

Con Mathematica
Escribir el comando ParametricPlot3D[{Cos[t], Sin[t], t}, {t, 0, 2 Pi}] y luego presionar Shift+Enter

EJEMPLO 6 Paraboloide circular de ecuación cartesiana explícita

Con Geogebra
Donde dice Entrada: escribir x^2 + y^2, presionar enter, luego ir a View y tildar 3D Graphics

Con Mathematica
Escribir el comando Plot3D[x^2 + y^2, {x,-2,2}, {ỵ,-2,2}] y luego presionar Shift+Enter

EJEMPLO 7 Esfera de ecuación cartesiana implícita
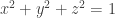
Con Geogebra
Donde dice Entrada: escribir x^2 + y^2 + z^2 = 1, presionar enter, luego ir a View y tildar 3D Graphics

Con Mathematica
Escribir el comando ContourPlot3D[x^2 + y^2 + z^2 == 1, {x,-1,1}, {ỵ,-1,1}, {z,-1,1}] y luego presionar Shift+Enter


Debe estar conectado para enviar un comentario.